
Nifty Reclaims Its 200-Week Moving Average as Traders Track Resistance Levels
The index closed at 23,146.15 on Friday, above a long-term trend line it failed to clear a week earlier; analysts watch 23,100–23,500
Synopsis
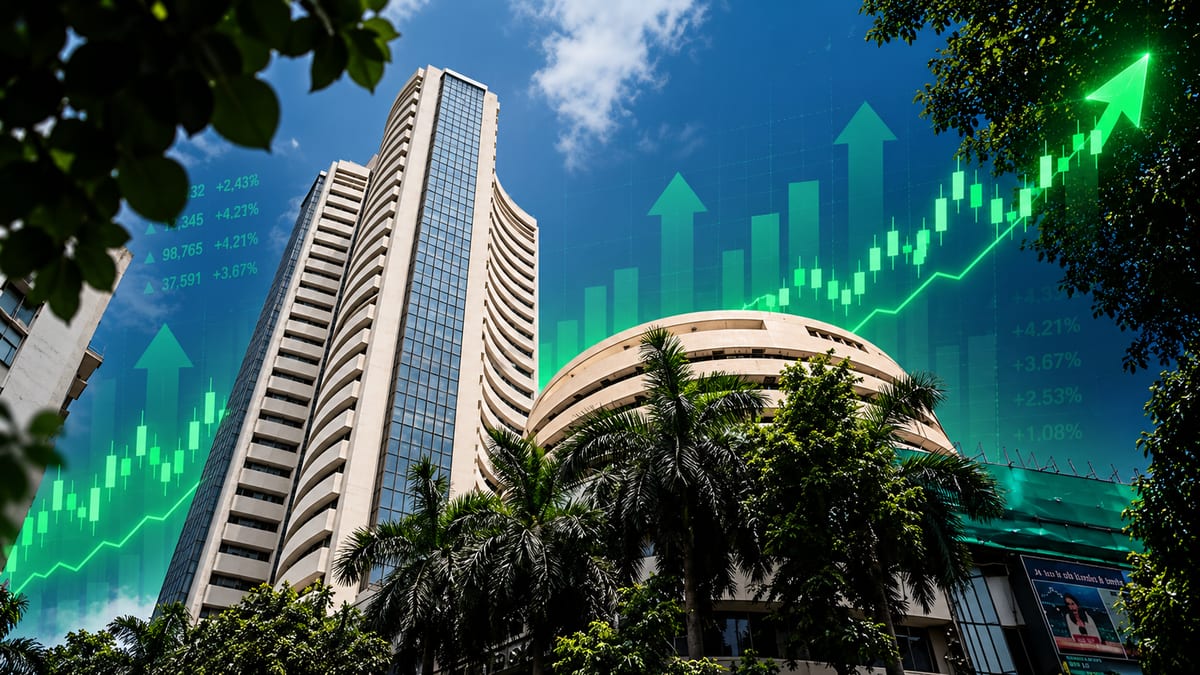
The Nifty 50 closed at 23,146.15, higher than its 200-week moving average of 22,600, estimated by analysts a week ago. The index had not ended that week with a positive reading since the previous week that it dropped. The immediate resistance is now seen at the level 23,100 to 23,150 and the next resistance at the level of 50-day average 23,500. Moving average readings fluctuate from one data source to another and change with time.
The Nifty 50 closed Friday above a 200-week moving average, which it failed to breach a week ago. Business Standard reports that the index touched 23,146.15 on Friday, up 0.65% from the previous week, to reflect a 2.78% increase over the last week.
Changing from a streak to a level
Coming off a losing streak. The Nifty had rallied by 98.50 points, or 0.44%, for a weekly loss, after eight consecutive losses, a week ago, but ended still under the 200-week average. StockCharts' “Week Ahead” column had the average at 22,627, and noted the 22,500–22,650 range was a “technically important area” as a support trendline met there. Other sources provided somewhat conflicting readings. I found Multibagg quoting 22,606 to 22,607 as the number rolled over the window, and it was around 22,565 earlier in this StockCharts note.
The short-term picture
The rally above the long-term line followed rallies in the shorter averages. The Nifty has stayed above the 20-day exponential moving average (22,865) for the first time since Aug. 25, 2026, Business Standard reported. The 22,776-22,800 level, which is a resistance zone, should now serve as immediate support, while near resistance zones are at 23,100-23,150, Nandish Shah, of HDFC Securities, said. He and other analysts cited in the newspaper believe the 50-day average, which is around 23,500, is the next benchmark to watch. The index was trying to recover from its short-term moving averages on widening volumes, said Dharmesh Bhatt of Systematix Institutional Equities.
Overhead supply
The higher up, the more to be cleared. Four weeks ago, at the time of the previous StockCharts note, the 20-week average was 23,955.75, the 100-week at 24,386.81 and the 50-week at 24,641.63. Those levels will have shifted but will represent areas where longer-term resistance was consolidating.
Why the level is important?
A 200-week average is a bull market indicator that is watched for a long time since it represents a period of about four years of closing prices. The index had been consolidating at a two-year high and testing a two-year low, which have now met, StockCharts pointed out. Closing above it, and remaining above it, is what analysts have been saying for a continued recovery.
Volatility and the week ahead
The India VIX, an indicator of anticipated volatility, jumped 5.67% to 15.28 in the week of the end of the streak. Meanwhile, the ICICI Bank and HDFC Bank's results on Saturday will take centre stage in near term direction, Reuters reported via Business Recorder adding that the Jio Platforms IPO could absorb liquidity.
Outlook
If 22,776–22,800 holds as support, analysts expect a test of 23,100–23,150 and then the 50-day average near 23,500. A close back under the 200-week moving average would bring the downside trend that those analysts identified back into play. These are only technical levels and not forecasts.
Latest News
- ◆Supreme Court Recognises Children’s Right to Internet Access, Cautions Against Blanket Bans
- ◆Supreme Court’s Week: College Fees, Reservation Eligibility and Online Child Safety
- ◆Delhi High Court Revives Disabled Man’s Abuse Complaint Against Ex-Wife, Her Family
- ◆Indian Equities Log Best Weekly Rally Since April as IT Stocks Lead
- ◆Nifty Reclaims Its 200-Week Moving Average as Traders Track Resistance Levels